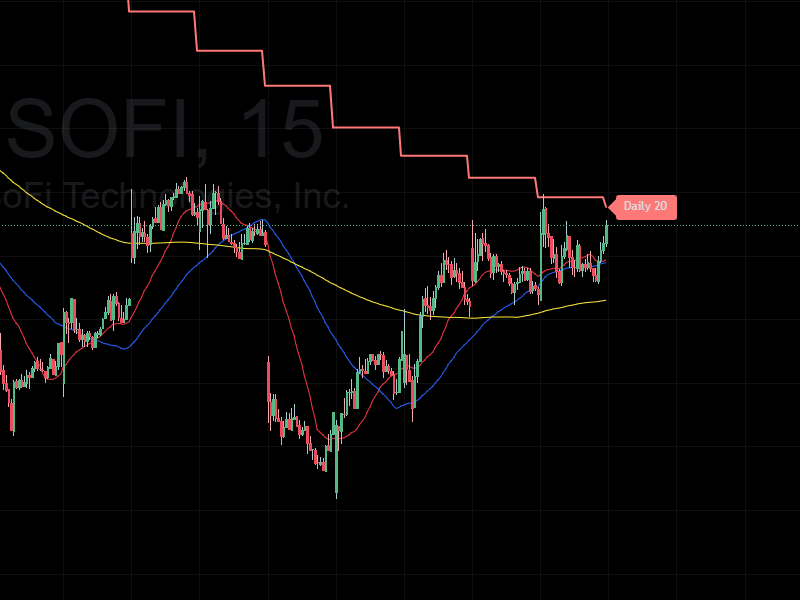
HTF Moving Averages — Daily, Hourly, and Weekly Auto‑Adaptive MAs
Shows 20/50/200 MAs from higher timeframes with automatic visibility by chart resolution (Daily on intraday charts, Hourly below 1H, Weekly below 1W).
Supports SMA/EMA/WMA/HMA/RMA source selection, per‑family confirmed-only mode (no intrabar updates), and separate style controls for Daily/Hourly/Weekly.
Includes optional on-chart labels with percent distance from price, adaptive label contrast, and built-in alert conditions for price crosses of each visible MA.
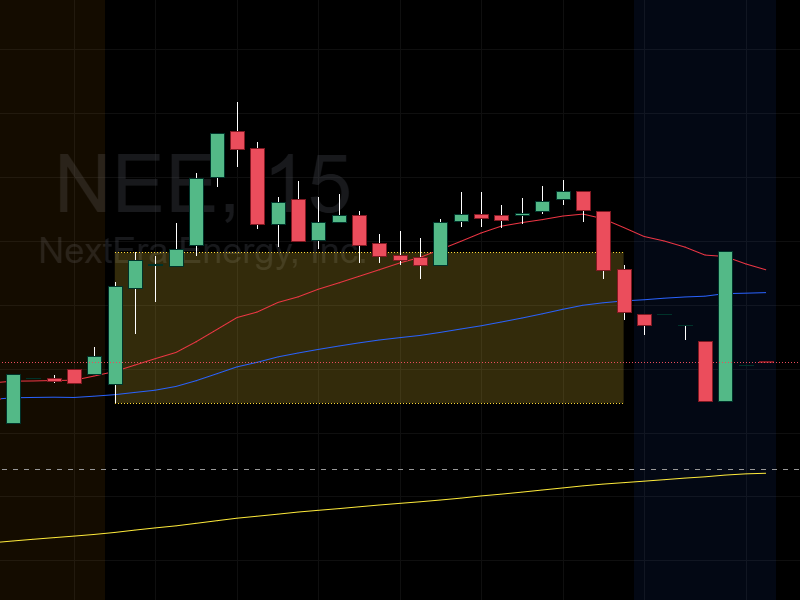
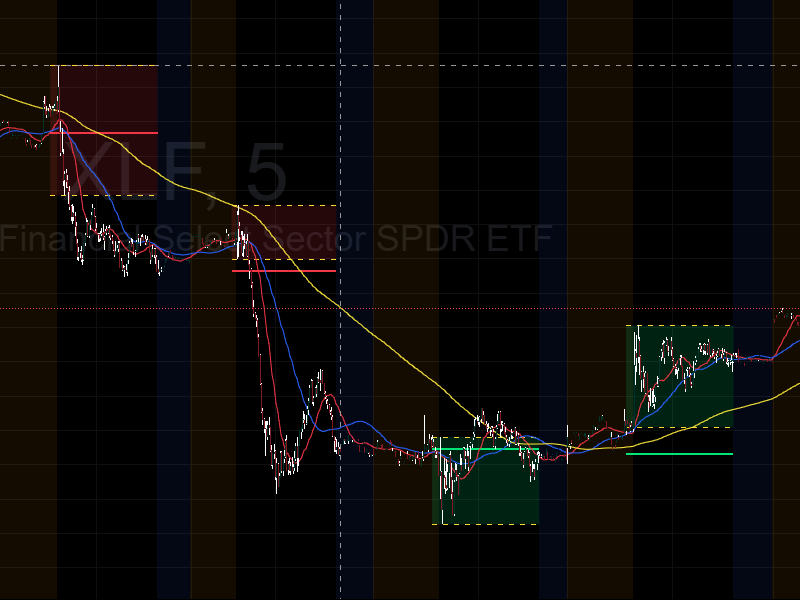
Current Day and Historical Opening Range (OR)
Draws the current-day OR using the first two 15-minute bars (or first 30-minute bar on 30m charts), with configurable line style, fill, and an optional midpoint line.
Also builds historical OR levels for prior sessions, supports pre-open extension, optional shading for recent days, and auto-colors historical OR fills by RTH close vs OR midpoint.
Previous Day Close
Draws a daily horizontal line at the prior RTH close from pre-open (RTH open minus configurable minutes) through RTH close.
Line color can respond to live price, gap at open, day close, or OR midpoint relationship, with per-day historical persistence and pruning controls.
Plots the opening range from the first two 15-minute RTH bars using timezone-aware
session inputs. Draws OR high/low lines with configurable color, style, width, and
optional fill, then extends the range through the RTH session using stable,
non-lookahead higher-timeframe data.